E-Commerce Tools For Website Design Types of Tools An Overview...


E-Commerce Tools For Website Design Types of Tools An Overview...
Most Prestigious Website Design Awards Acknowledging The Work Giving Recognition...
Optimizing Website For Voice Search Optimizing Website For Voice Search...
Important Questions To Ask Any Potential Web Design & Development...
Responsive Website Design: One Site Fits All Investing in a...
How Do I Increase Clicks With Online Banner Advertising? Online...
Guide To SEO for E-Commerce Websites The Importance of SEO...
6 Factors to Consider When Choosing the Right Web Design...
What Are The Elements Of Good Interaction Design? Good SEO...
Meet Our Clients: Escape Games | Video Production Working with...
Why Should I Use Landing Pages For PPC And What...
7 Types Of Content That Will Increase Your Business Increase...
What are the Worst Design Flaws for Law Firm Websites?...
Understanding The Difference Between SEO And SEM SEO and SEM...
What Trends In Web Design Are We Seeing In 2015?...
Why You Must Work With SEO Companies in Toronto That...
How To Optimize Your Law Firm Online Presence A high...
Some SEO Agencies Limit Keywords Why Do Some SEO Agencies...
How To Update Website By Yourself Design Changes Can I...
How Do I Get Started With A Google Remarketing Campaign?...
What Are Some Tips for Having a Great Online Store...
A Guide to the F Pattern Layout for Text-Heavy Websites...
Relaunching Your Website Without Affecting SEO Avoid Losing Your Ranking...
Blog Search Engine Marketing Benefits & Ideas For Local SEO...
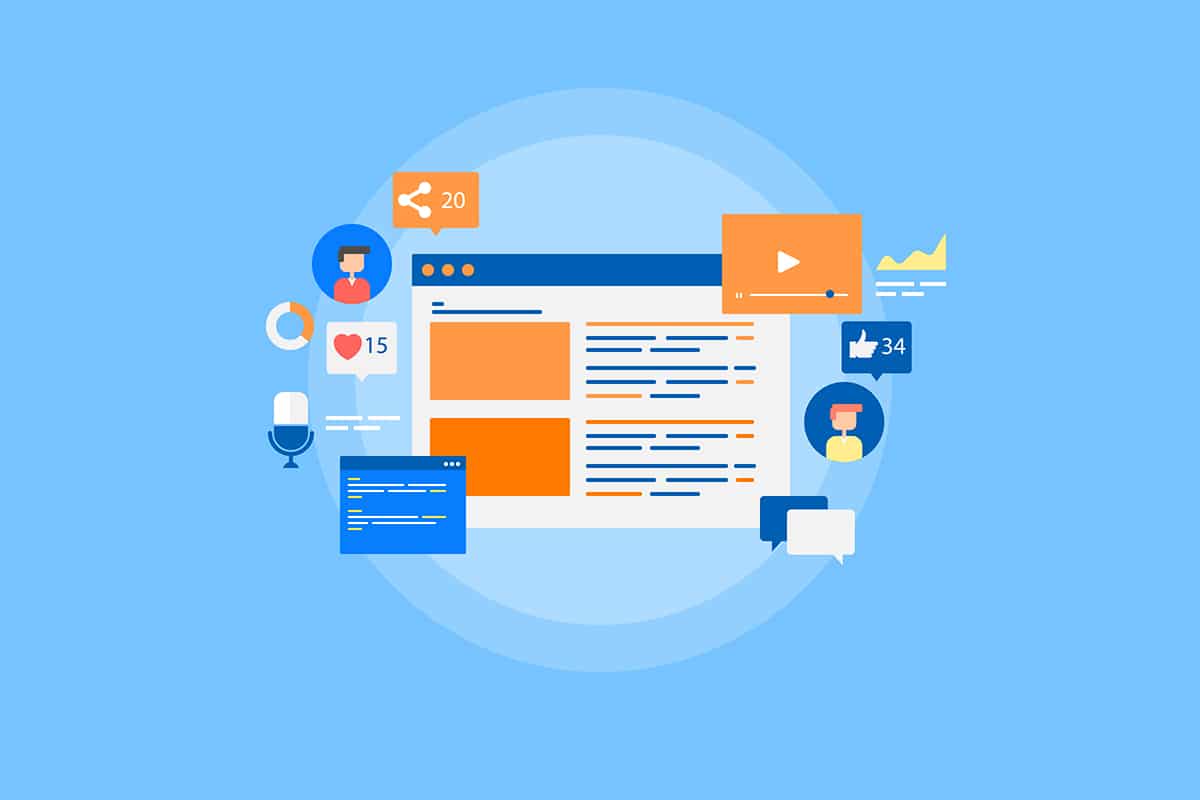
Social Media Platforms For SEO How Does Social Media Help...
Why Does Landing Page Design Matter? We are often asked...
Developing Website Marketing Strategies How Website Design Impacts on Your...
How To Turn Your Social Media Followers Into Customers Turn...
What Are Some Unique Tactics Offered by SEO Companies? Unique...
Learn About SEO In Toronto With These Helpful Guides &...
PPC vs SEO: Knowing The Differences I Already Do PPC,...
Local SEO For Multiple Locations Local SEO SEO Techniques It’s...
Effective Marketing Strategies Don’t Only Focus On SEO Effective Marketing...
The Importance Of Colours In Web Design Mix Shades And...
My Website Was Penalized By Google! Can You Help? When...
Benefits Of Using Web Design Templates Types of Templates You...
Why is Shopping Cart Development Important? Online Businesses The Shopping...
SEO Companies & Relationships Do SEO Companies Really Have Special...
Google Rolling Out The New Rounded Search Results Layout Have...
6 Product Design Principles Every Organization Can Adapt Product Design...